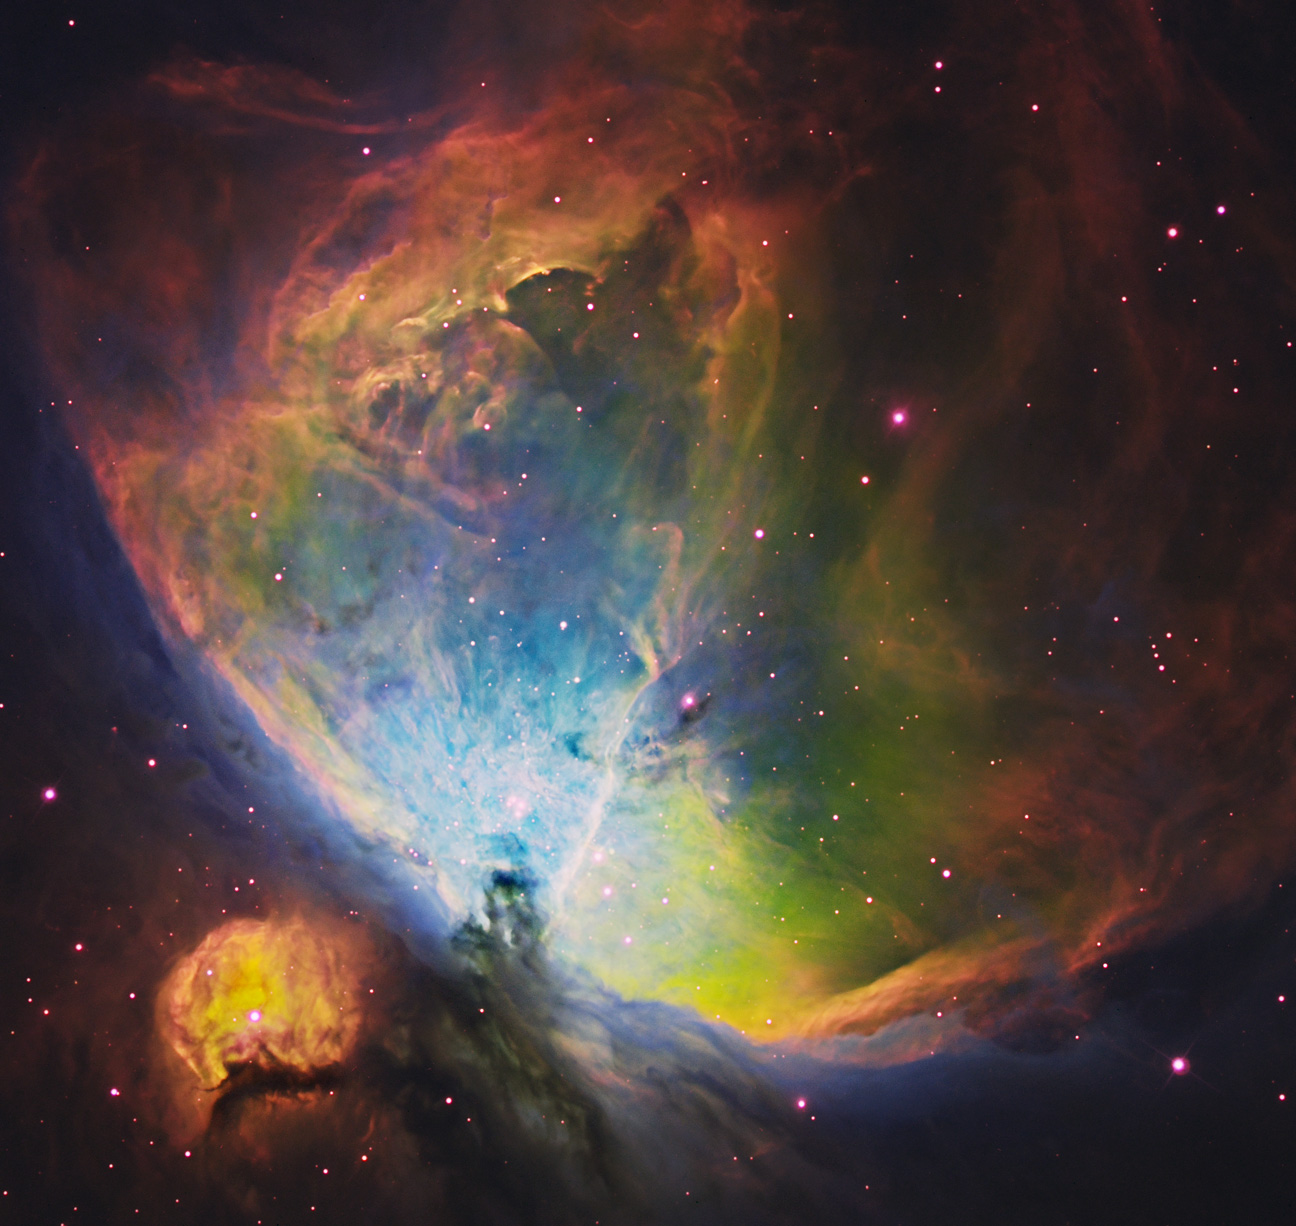
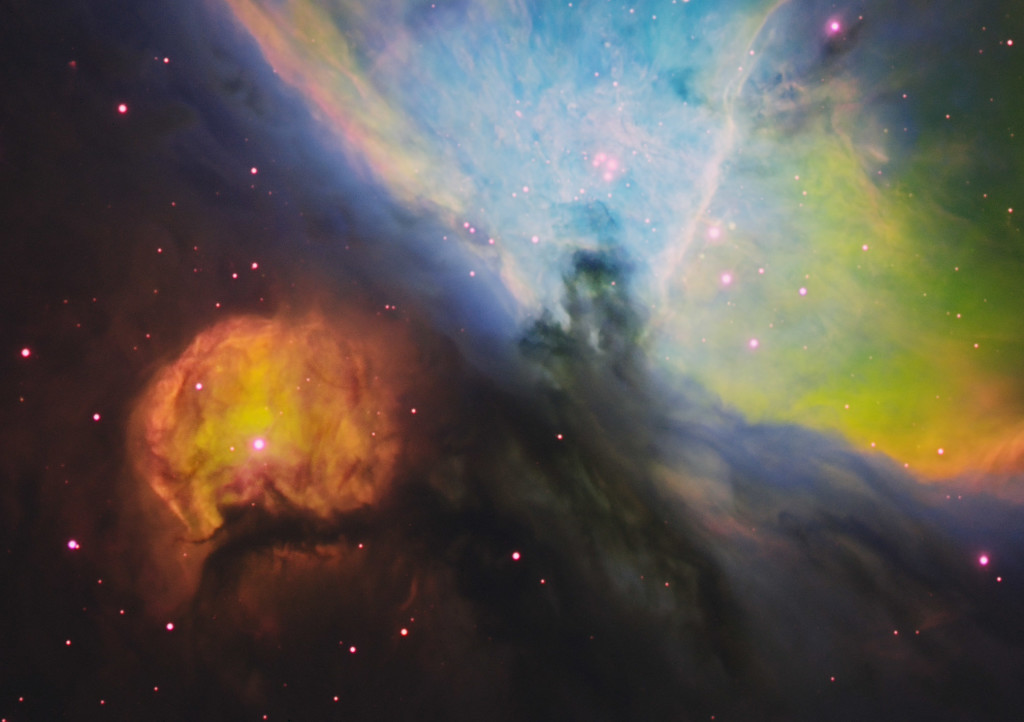
I finally decided to try my hand at mapped emission-line imaging inspired by the beautiful work of Russ Croman of Texas and Don Goldman of California. Narrowband filters are fun because you can use them in light-polluted skies and during moonlit nights. You can create an image using only narrowband data in which case you decide which filters you will assign to which color (mapping). Or you can enhance “natural color” images with narrowband data as I did last year with my M82 image adding hydrogen-alpha data to the red channel in the creation of a LR(H-a)GB image accentuating the “explosion”. The above Orion Nebula images are strictly emission-line/narrowband data using 3 filters: SII (673nm), H-alpha (656nm), OIII (501nm) all 5nm bandpass Astrodon filters. I mapped SII as RED, H-alpha as GREEN and OIII as BLUE which is the “Hubble” palette. Because the SII image looked so detailed, I also used the SII data as a sharpened luminance (L) for contrast and detail support. So the final image is L(SII)R(SII)G(H-a)B(OIII). The gif “movie” shows the data separately. You can readily see why I used the SII data as the luminance! Another nice thing about narrowband data is that it disproportionately reduces star size which is very helpful in objects like M42, the Eagle and Lagoon Nebs.
Why bother creating emission-line images? Because you can see objects in details not always apparent in broadband filter images. The different filters map “energy zones” based on the differences in energy needed to create a particular form of element ionization. OIII takes more energy than H-alpha and SII takes the least (OIII>Ha>SII). So by mapping OIII in an image as blue and SII as red, the bluer areas are hotter/more excited than the red/orange areas. In the M42 image, the blue areas are closest to the Trapezium stars which power the whole nebula so this is the most energetic area. The outer festoons are red-orange as SII (requiring less energy) predominates over OIII. I guess this is intuitive. My wife Sandy, upon hearing this “discovery” says “Bill – you have a thorough grasp of the obvious!”. OK – so it’s a beginning. But, how do you explain the divergent colors of the wings, some blue, some orange? They must be a very different distances from the Trapezium which isn’t so obvious by looking at a LRGB image (at least not to me). This is fun imaging consisting of only 12 minutes of H-alpha, 30 minutes of OIII, and 1 hour of SII data with the 14.5-inch RCOS at f/9 using my new Apogee U16M camera at Chiefland in cold January.